A.R.C. Archive. Ready. Cloud.
An app that looks at what you own and tells you whether your insurance actually covers it.
Field Home Inventory Computer Vision Insurance Technology
Author Jeremy Prasatik Published: 2024 Status: V1 Live In market
Classification Product Design Brand Identity Full-Stack Engineering Go-to-Market
TL;DR Built→ Camera-scan home inventory app. Vision recognition, value estimation, insurance gap analysis.Scope→ Solo, end to end. Concept, code, brand, go-to-market.Stack→ Python, Streamlit, OpenAI Vision, Perceptron Mk1, Supabase, Vercel, Claude Code.Angle→ Nobody skips home inventory because they don't care. They skip it because the work is miserable. Remove the input problem and the rest is straightforward.
Abstract
Home inventory is a solved problem that nobody has solved well. The average American household contains around 300,000 items with a combined insurable value most homeowners have never calculated, and the existing tools haven't moved the needle - they're spreadsheets with better packaging, asking people to do the same manual work they'd been avoiding all along. The result is predictable. About 60% of homeowners are underinsured because they've never cataloged what they own.
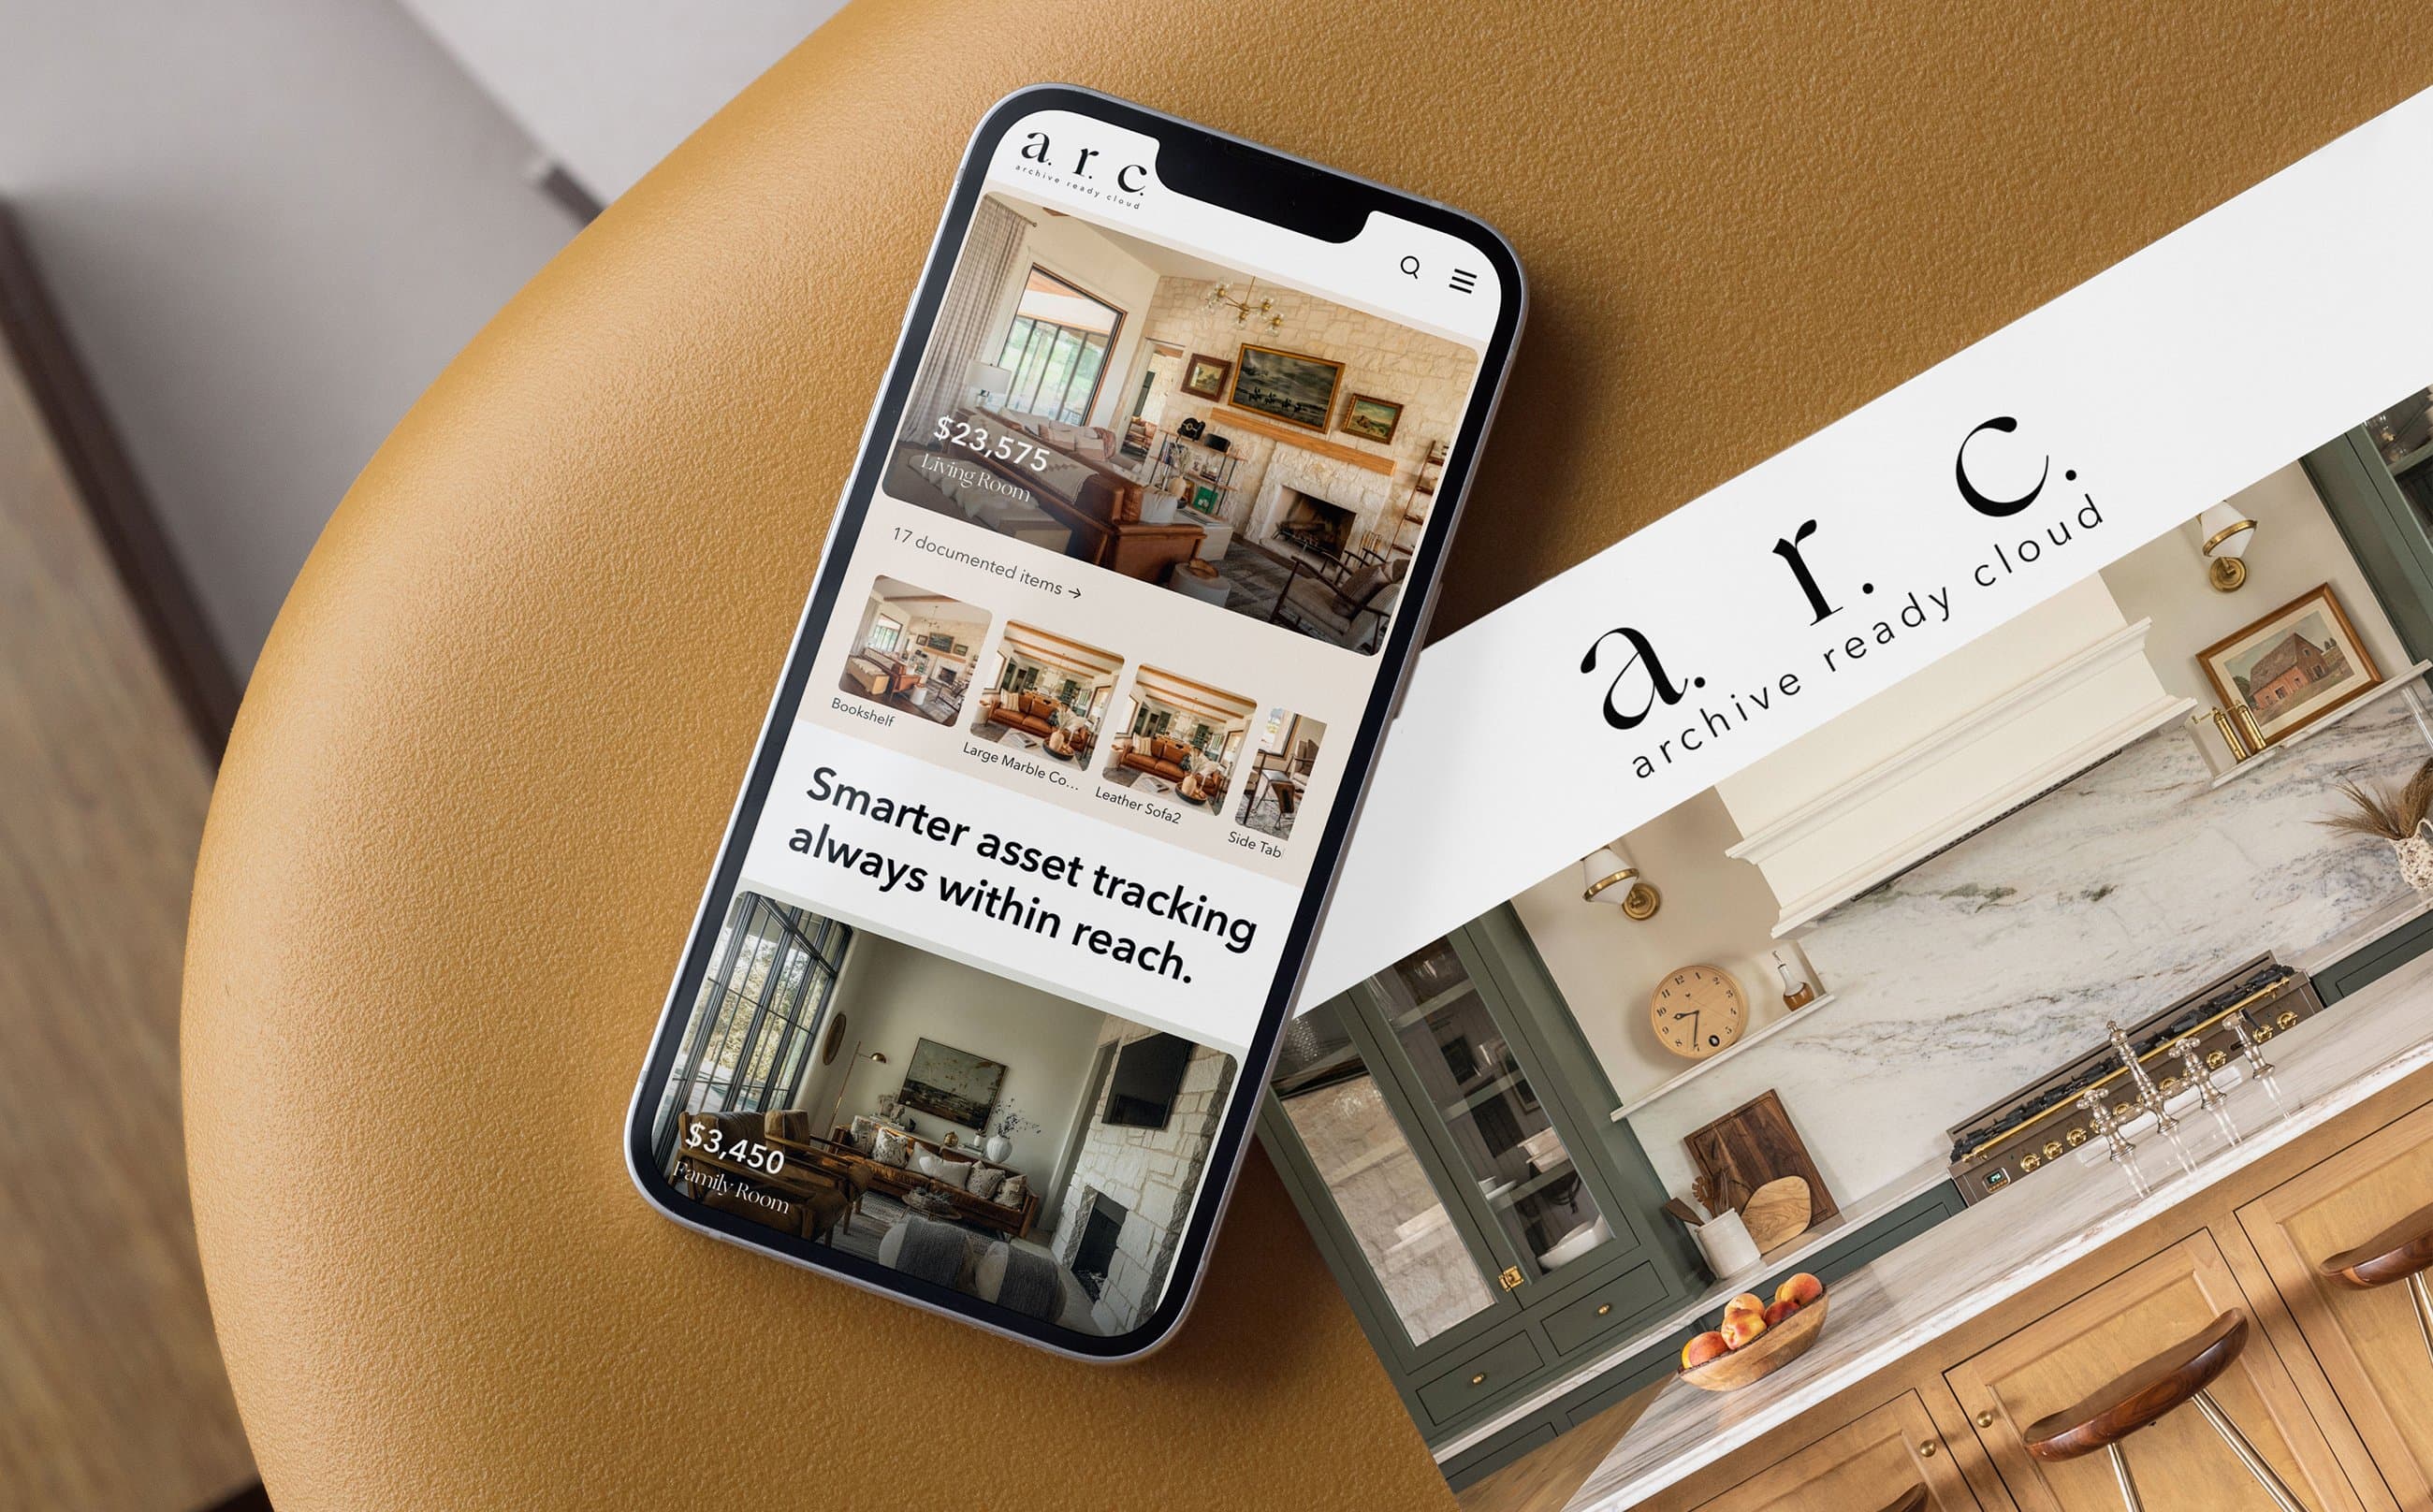
A.R.C. works differently. You point a camera at a room - photo or video - and the system identifies what's there, estimates replacement value, and categorizes everything in the same pass. Video scanning, powered by Perceptron's Mk1 model, makes this even faster - sweep a room and the model reasons across the footage in real time. Then A.R.C. compares what you've documented against your policy limit and shows you the gap as an actual dollar amount.
I built A.R.C. end to end - concept, code, brand, go-to-market. Python backend, Streamlit frontend, OpenAI Vision API and Perceptron Mk1 for recognition, deployed on Vercel with Supabase handling data persistence. Concept to live product in ten weeks.
Nobody Does This
About 60% of American homeowners are underinsured, and the reason is simpler than it sounds - they've never written down what they own. The apps that exist haven't fixed this because they all ask you to do the same tedious work by hand.
Based on industry estimates of homeowner documentation rates and average coverage gaps.


The insurance industry operates on a fundamental asymmetry. Carriers know exactly what they'll pay on a policy. Homeowners rarely know what they'd need to claim. This gap widens with every purchase, every gift, every inherited piece that enters a home without documentation.
Standard homeowner's policies cover personal property at 50-70% of the dwelling coverage amount. A home insured at $400,000 carries roughly $200,000-$280,000 in personal property coverage. Whether that number is adequate depends entirely on whether the homeowner knows what they own and what it costs to replace. Most don't.
The documentation process is the barrier. Open a spreadsheet. Walk room to room. Describe each item. Research replacement values. Photograph everything. Attach receipts. The estimated time to properly inventory an average home: 40+ hours. The percentage of homeowners who complete this process: single digits.
I downloaded every home inventory app I could find before building this. They all land in the same place. Some are just spreadsheets wearing a better outfit - you still type in every item, attach every photo, look up every replacement value yourself. The app adds a database and maybe cloud sync, but the actual work is identical to the spreadsheet it replaced.
The others are insurance carrier tools, built for their own ecosystem, designed to make claims processing easier for adjusters rather than documentation easier for homeowners. The interfaces feel like it - functional, dense, built for someone who already knows what they're looking at.
The shared problem is that every one of them still asks you to identify and value each item yourself, one at a time. That's the part nobody wants to do, and no amount of better UI changes it.
The fix is changing what the person has to do. Instead of describing everything you own, you show it. The camera sees a room, the system identifies what's there, estimates values, and categorizes - and your job becomes reviewing what it found rather than entering it from scratch.
Video takes this further. Perceptron's Mk1 model was built specifically for understanding the physical world through footage - it reasons across frames, tracks objects through space, and handles the kind of spatial context that a single photo misses. Sweep a room with your phone camera and Mk1 processes the whole thing. It's genuinely fast, and the recognition quality is excellent.
That shift is what makes the difference. A full home inventory that would take 40+ hours by hand becomes a room-by-room scan that takes minutes. I built A.R.C. on the idea that if you remove the input problem, the rest of home inventory is actually straightforward.
The Insurance Reality
The insurance industry operates on a fundamental asymmetry. Carriers know exactly what they'll pay on a policy. Homeowners rarely know what they'd need to claim. This gap widens with every purchase, every gift, every inherited piece that enters a home without documentation.
Standard homeowner's policies cover personal property at 50-70% of the dwelling coverage amount. A home insured at $400,000 carries roughly $200,000-$280,000 in personal property coverage. Whether that number is adequate depends entirely on whether the homeowner knows what they own and what it costs to replace. Most don't.
The documentation process is the barrier. Open a spreadsheet. Walk room to room. Describe each item. Research replacement values. Photograph everything. Attach receipts. The estimated time to properly inventory an average home: 40+ hours. The percentage of homeowners who complete this process: single digits.
Existing Solutions
I downloaded every home inventory app I could find before building this. They all land in the same place. Some are just spreadsheets wearing a better outfit - you still type in every item, attach every photo, look up every replacement value yourself. The app adds a database and maybe cloud sync, but the actual work is identical to the spreadsheet it replaced.
The others are insurance carrier tools, built for their own ecosystem, designed to make claims processing easier for adjusters rather than documentation easier for homeowners. The interfaces feel like it - functional, dense, built for someone who already knows what they're looking at.
The shared problem is that every one of them still asks you to identify and value each item yourself, one at a time. That's the part nobody wants to do, and no amount of better UI changes it.
The Vision Layer
The fix is changing what the person has to do. Instead of describing everything you own, you show it. The camera sees a room, the system identifies what's there, estimates values, and categorizes - and your job becomes reviewing what it found rather than entering it from scratch.
Video takes this further. Perceptron's Mk1 model was built specifically for understanding the physical world through footage - it reasons across frames, tracks objects through space, and handles the kind of spatial context that a single photo misses. Sweep a room with your phone camera and Mk1 processes the whole thing. It's genuinely fast, and the recognition quality is excellent.
That shift is what makes the difference. A full home inventory that would take 40+ hours by hand becomes a room-by-room scan that takes minutes. I built A.R.C. on the idea that if you remove the input problem, the rest of home inventory is actually straightforward.

Nobody skips this because they don't care. They skip it because the work is miserable.
System Architecture & Recognition Engine.
One photo or video starts the whole process - from raw input to cataloged, valued, and categorized items.
The image passes through vision processing, object identification, value estimation, and archival. Each stage feeds the next. Each decision point governed by confidence thresholds. Processing time measured under typical indoor lighting conditions.

Image Capture
User photographs a room or individual item using their device camera. No special hardware. No calibration. Standard smartphone optics.

Vision Processing
OpenAI Vision API receives the image and returns structured analysis. Object identification, material detection, style classification, condition assessment, estimated era or manufacture period.

Value Estimation
Identified objects are matched against market replacement data. The system estimates current replacement cost, not depreciated value or original purchase price. Replacement cost is the insurance-relevant metric.
Image Capture
User photographs a room or individual item using their device camera. No special hardware. No calibration. Standard smartphone optics.
Archive Entry
The documented item enters the user's structured inventory. Linked to a room, tagged with metadata, associated with its source photograph, and immediately included in aggregate calculations.
Vision Processing
OpenAI Vision API receives the image and returns structured analysis. Object identification, material detection, style classification, condition assessment, estimated era or manufacture period.
Financial Analysis
Total documented value updates in real time. The system compares cumulative asset value against the user's stated policy limits. When documented assets approach or exceed coverage thresholds, the shortfall shows up as a specific dollar amount. The homeowner sees it before a disaster reveals it.
Value Estimation
Identified objects are matched against market replacement data. The system estimates current replacement cost, not depreciated value or original purchase price. Replacement cost is the insurance-relevant metric.
Category Assignment
Each item is classified into a taxonomy: furniture, electronics, artwork, appliances, fixtures, textiles, collectibles, vehicles, tools, sporting goods, musical instruments, jewelry, documents. Sub-categories provide additional granularity.
Classification System
Taxonomy designed for insurance relevance, not retail categorization. Each category maps to standard personal property claim classifications.
Sub-categories provide the granularity needed for accurate valuation without requiring specialized knowledge from the user. Aligned with classifications used by major U.S. carriers.
Scroll to explore →

Insurance Gap Analysis
This is the part that makes A.R.C. more than inventory software.
Documented asset value compared against user-reported policy limits. Gap shown as a specific dollar amount before a disaster reveals it.
Every item you document adds to a running total, and that total gets compared against your policy limit for personal property. The arithmetic is obvious. What's less obvious is how far off most people are.
Most homeowners set their coverage amount when they buy the policy and never touch it again. But the stuff inside the house keeps changing - new furniture, upgraded appliances, gifts, pieces inherited from parents. A home that was adequately covered five years ago might be $50,000 short today, and the homeowner has no way of knowing until something goes wrong.
A.R.C. puts a number on the gap. A specific dollar amount, tied to specific items, in specific rooms - before a disaster reveals it.
Scroll to explore →
Visual Identity & Design Language
The brand had to solve a tension. Home inventory sounds like a chore. Insurance analysis sounds like a meeting with your agent. Neither association invites engagement. The visual identity needed to make documentation feel like something worth doing, not something you should get around to eventually.
Brand philosophy
The solution was editorial warmth applied to utility software. Magazine sensibility meets insurance rigor. The interface treats data as something worth designing, not just storing. Asset cards that feel like collection entries. Room views that read like curated galleries. Financial summaries that carry the weight of their content without the sterility of a spreadsheet.
Colour system / values
HEX #B1BC94
CMYK 34 16 50 0
HEX #C4A265
CMYK 0 17 48 23
HEX #000000
CMYK 0 0 0 100
Typography / weight
Chromatic Brand Circle
RGB 177/188/148
Photography tones
Structure, text
Solo Engineering Concept to Deployment
Ten weeks from concept to a live App Store product. Solo build. AI-assisted throughout.
Claude Code as the primary development environment. Python backend, Streamlit frontend, deployed on Vercel. No engineering team behind any of it.
Building solo means I made every decision and shipped every line. There was no engineering team, no PM assigning tickets, no design review, no QA department. I identified the problem, designed the solution, wrote the code, tested the output, fixed what broke, and shipped the result.
This isn't a limitation - it's a speed advantage. The feedback loop between noticing a problem and deploying a fix runs in hours, not sprints. UX friction caught during testing gets resolved in the same session. A feature idea that surfaces during development gets prototyped right away. The distance between intention and execution stays as short as I could make it.
The tradeoff is real. Solo means every decision is a prioritization decision - what ships now versus what ships later, what gets polished versus what gets to functional. V1 reflects those choices honestly. Comprehensive in scope, considered in design, pragmatic where it had to be.
Claude Code was my primary environment throughout. The workflow looked something like this: I'd describe what I wanted in natural language, review the code that came back, test the output, refine through conversation, ship. Repeat until the feature worked.
This setup inverts the old bottleneck. The constraint isn't syntax fluency or framework expertise anymore. It's clarity of intention. Knowing exactly what the product should do matters more than knowing exactly how to make it do it - and that's the part design experience actually prepares you for.
A.R.C. uses AI to do its core job. A.R.C. was also built with AI to make it. Same toolset, two sides of the same equation, which is part of what makes the whole thing possible at this scale and speed.
Weeks 1-2 went to concept validation. Could computer vision reliably identify household items from standard smartphone photos? I tested across lighting conditions, angles, and room types. The answer was yes, with caveats that ended up shaping the UX.
Weeks 3-4 were product architecture - database schema, user flow, room and item data models, authentication, storage. The foundational decisions everything else builds on.
Weeks 5-6 were interface design and implementation, happening at the same time. That's the part you can't really do at a traditional studio - no handoff gap between design intent and what shows up in code.
Weeks 7-8 were the financial layer. Insurance gap calculations, policy limit comparisons. This is the feature that turns A.R.C. from a documentation tool into a risk management one.
Weeks 9-10 were brand identity, visual system, marketing site, and the go-to-market work. Then launch. Ten weeks, start to finish.
Building Solo
Building solo means I made every decision and shipped every line. There was no engineering team, no PM assigning tickets, no design review, no QA department. I identified the problem, designed the solution, wrote the code, tested the output, fixed what broke, and shipped the result.
This isn't a limitation - it's a speed advantage. The feedback loop between noticing a problem and deploying a fix runs in hours, not sprints. UX friction caught during testing gets resolved in the same session. A feature idea that surfaces during development gets prototyped right away. The distance between intention and execution stays as short as I could make it.
The tradeoff is real. Solo means every decision is a prioritization decision - what ships now versus what ships later, what gets polished versus what gets to functional. V1 reflects those choices honestly. Comprehensive in scope, considered in design, pragmatic where it had to be.
AI-Assisted Development
Claude Code was my primary environment throughout. The workflow looked something like this: I'd describe what I wanted in natural language, review the code that came back, test the output, refine through conversation, ship. Repeat until the feature worked.
This setup inverts the old bottleneck. The constraint isn't syntax fluency or framework expertise anymore. It's clarity of intention. Knowing exactly what the product should do matters more than knowing exactly how to make it do it - and that's the part design experience actually prepares you for.
A.R.C. uses AI to do its core job. A.R.C. was also built with AI to make it. Same toolset, two sides of the same equation, which is part of what makes the whole thing possible at this scale and speed.
Development Timeline
Weeks 1-2 went to concept validation. Could computer vision reliably identify household items from standard smartphone photos? I tested across lighting conditions, angles, and room types. The answer was yes, with caveats that ended up shaping the UX.
Weeks 3-4 were product architecture - database schema, user flow, room and item data models, authentication, storage. The foundational decisions everything else builds on.
Weeks 5-6 were interface design and implementation, happening at the same time. That's the part you can't really do at a traditional studio - no handoff gap between design intent and what shows up in code.
Weeks 7-8 were the financial layer. Insurance gap calculations, policy limit comparisons. This is the feature that turns A.R.C. from a documentation tool into a risk management one.
Weeks 9-10 were brand identity, visual system, marketing site, and the go-to-market work. Then launch. Ten weeks, start to finish.

Application Views & Data Architecture
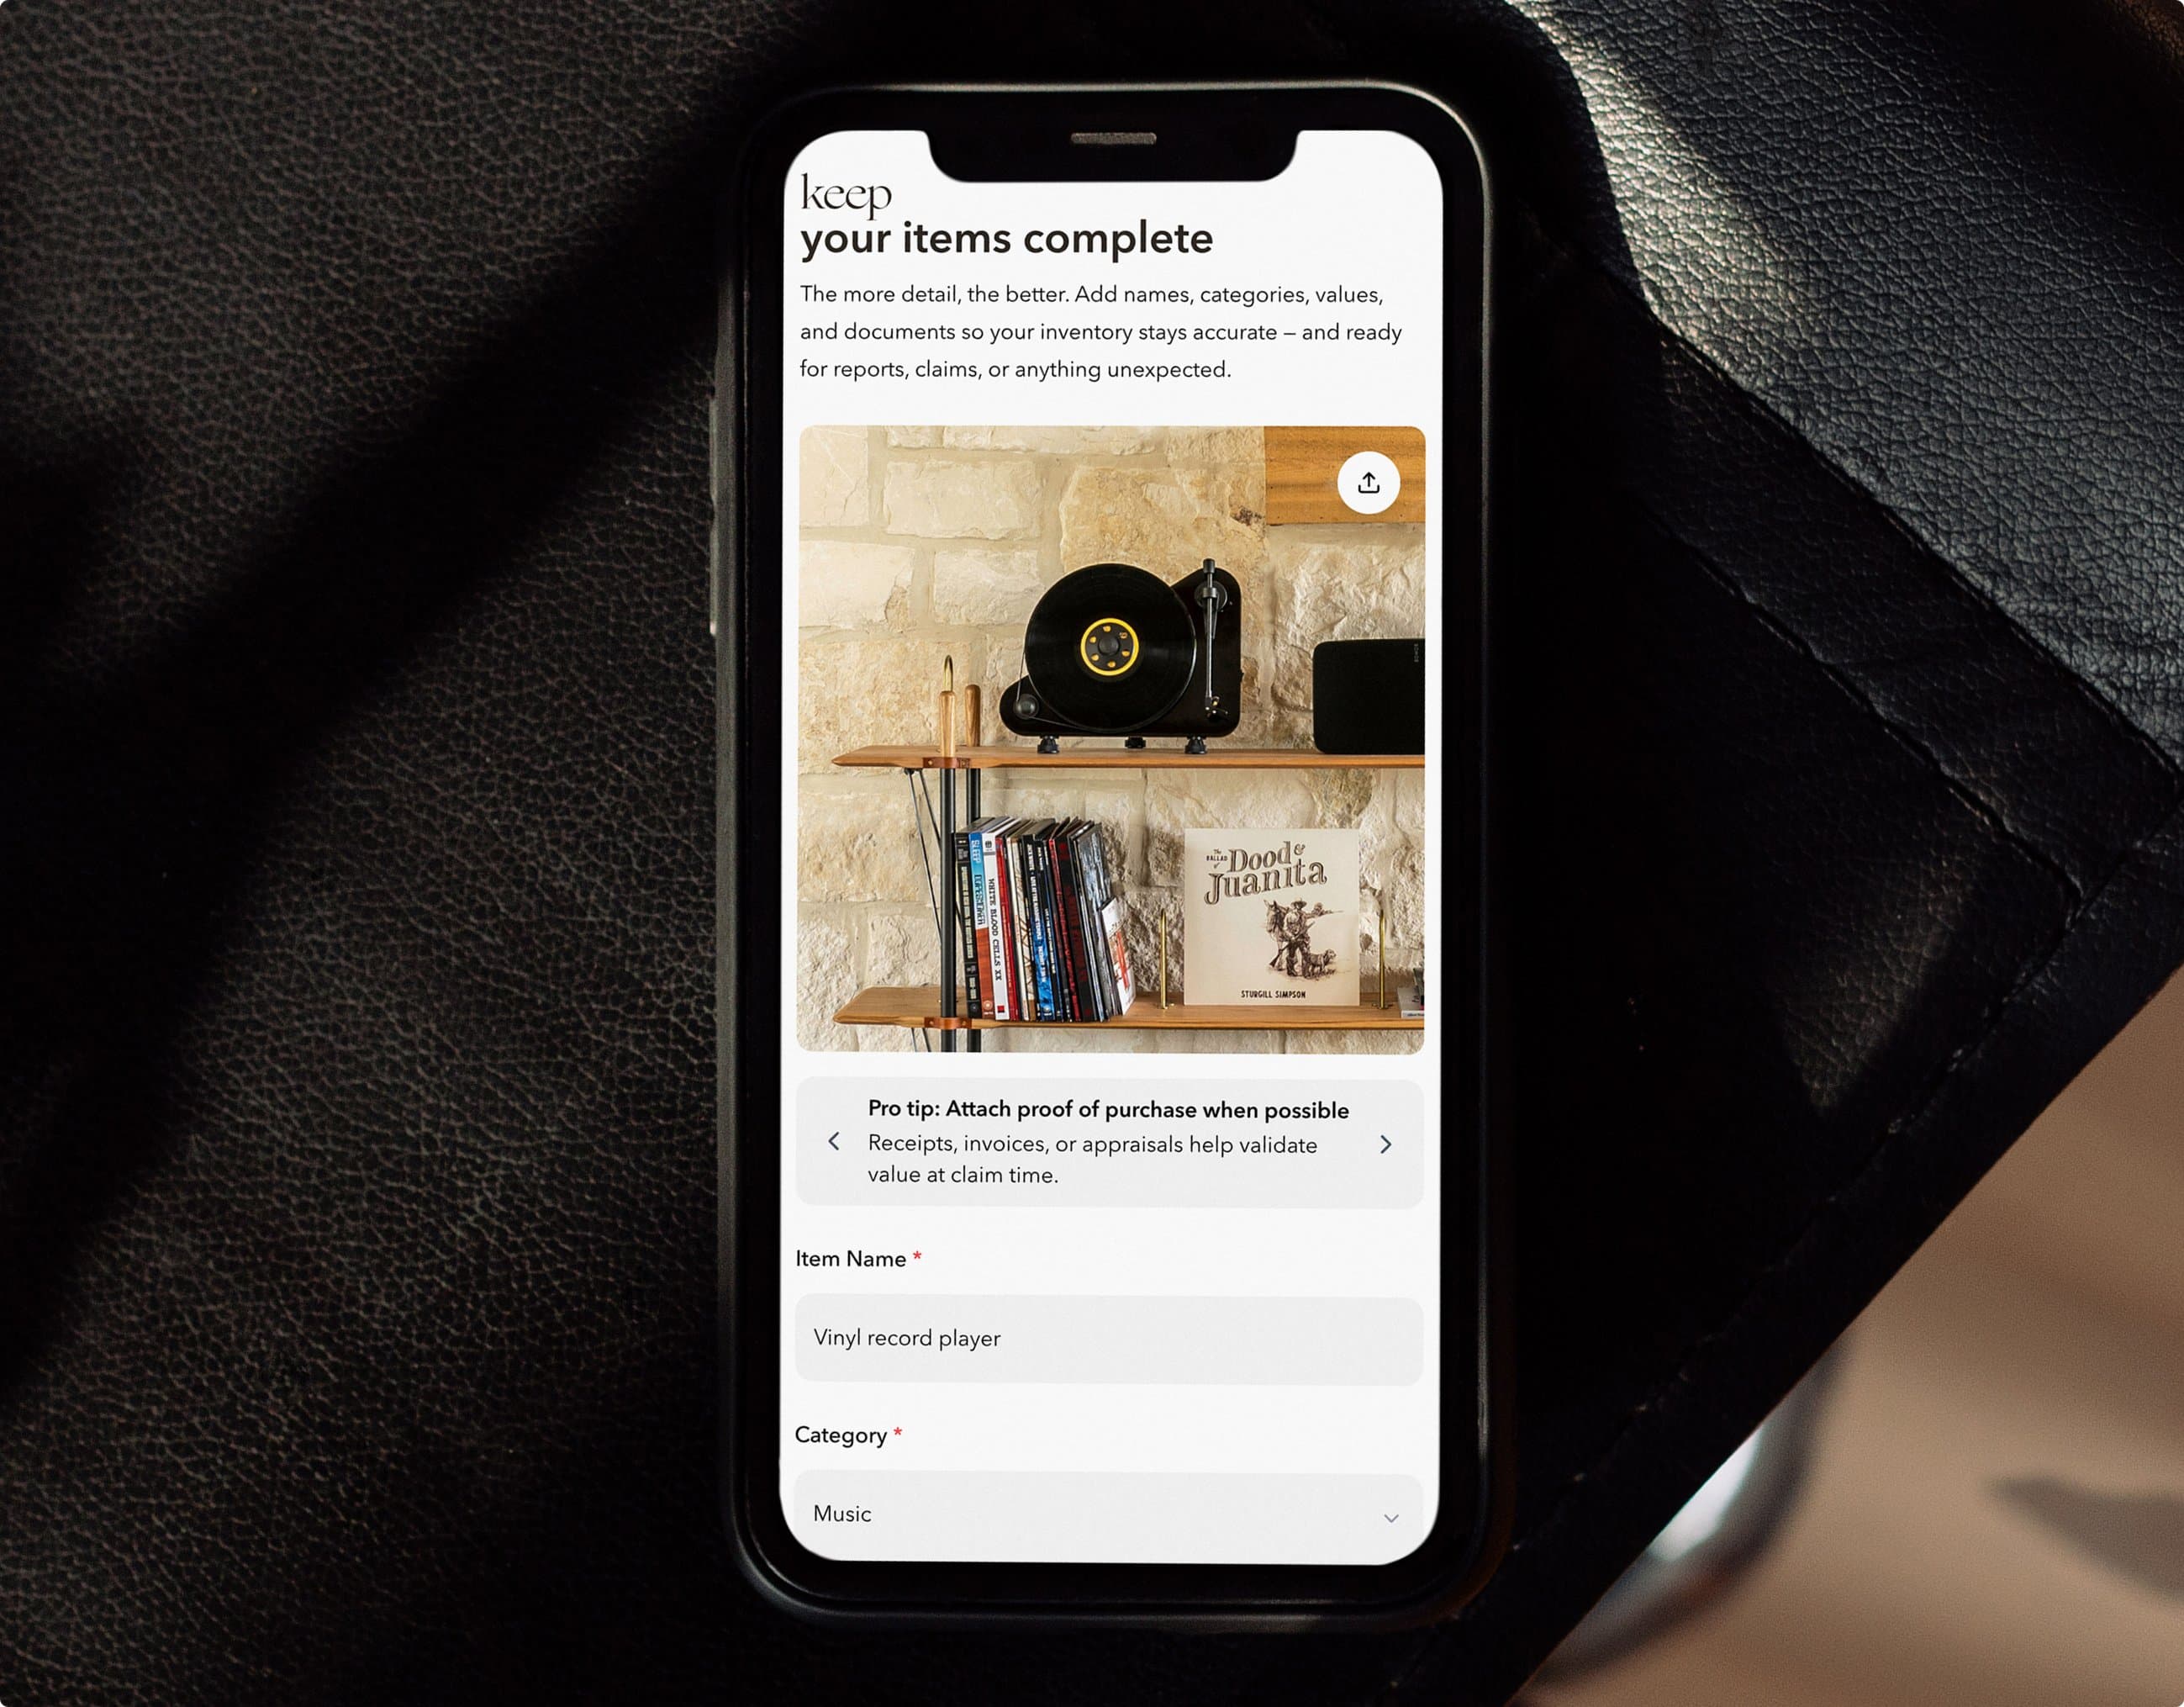
The interface treats your stuff like it matters - because financially, it does.
Dashboard, room, item detail, and report views. All screens reflect V1 production application with representative usage data.

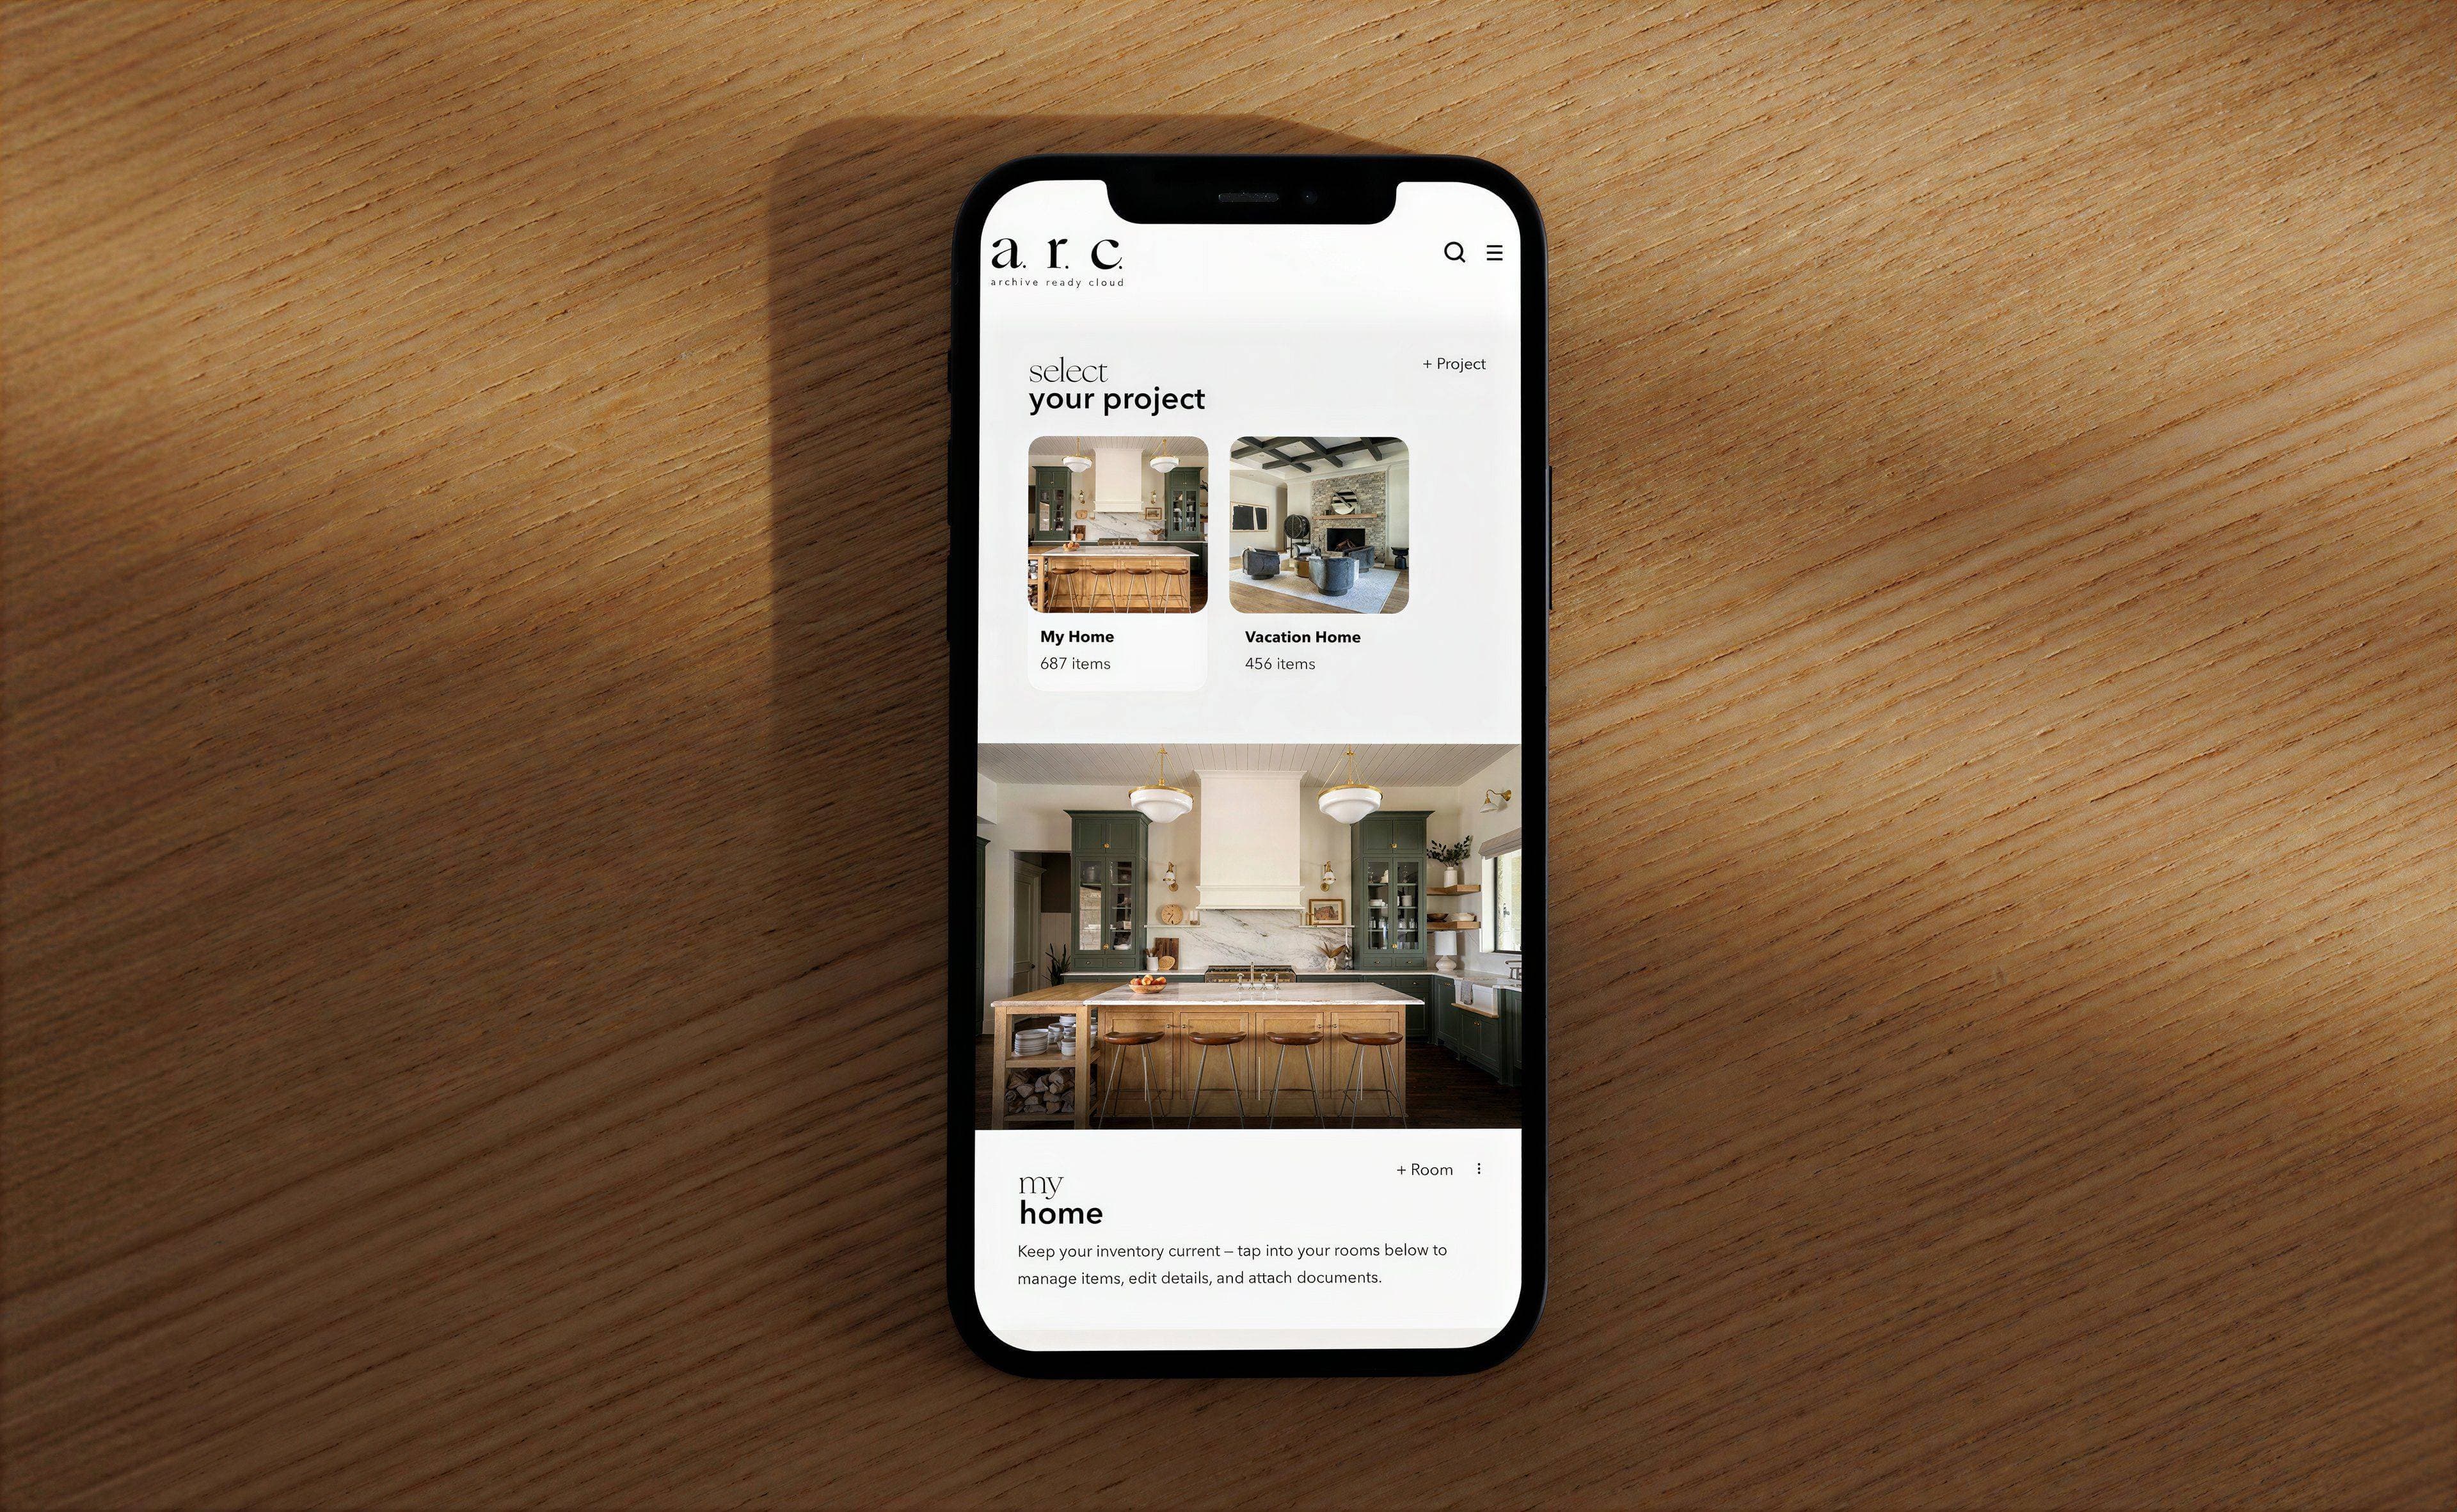
Dashboard View
The home screen presents aggregate intelligence. Total items documented. Total estimated value. Category breakdown. Coverage status. Recent activity. The information hierarchy prioritizes financial awareness: what you own, what it's worth, whether you're covered.

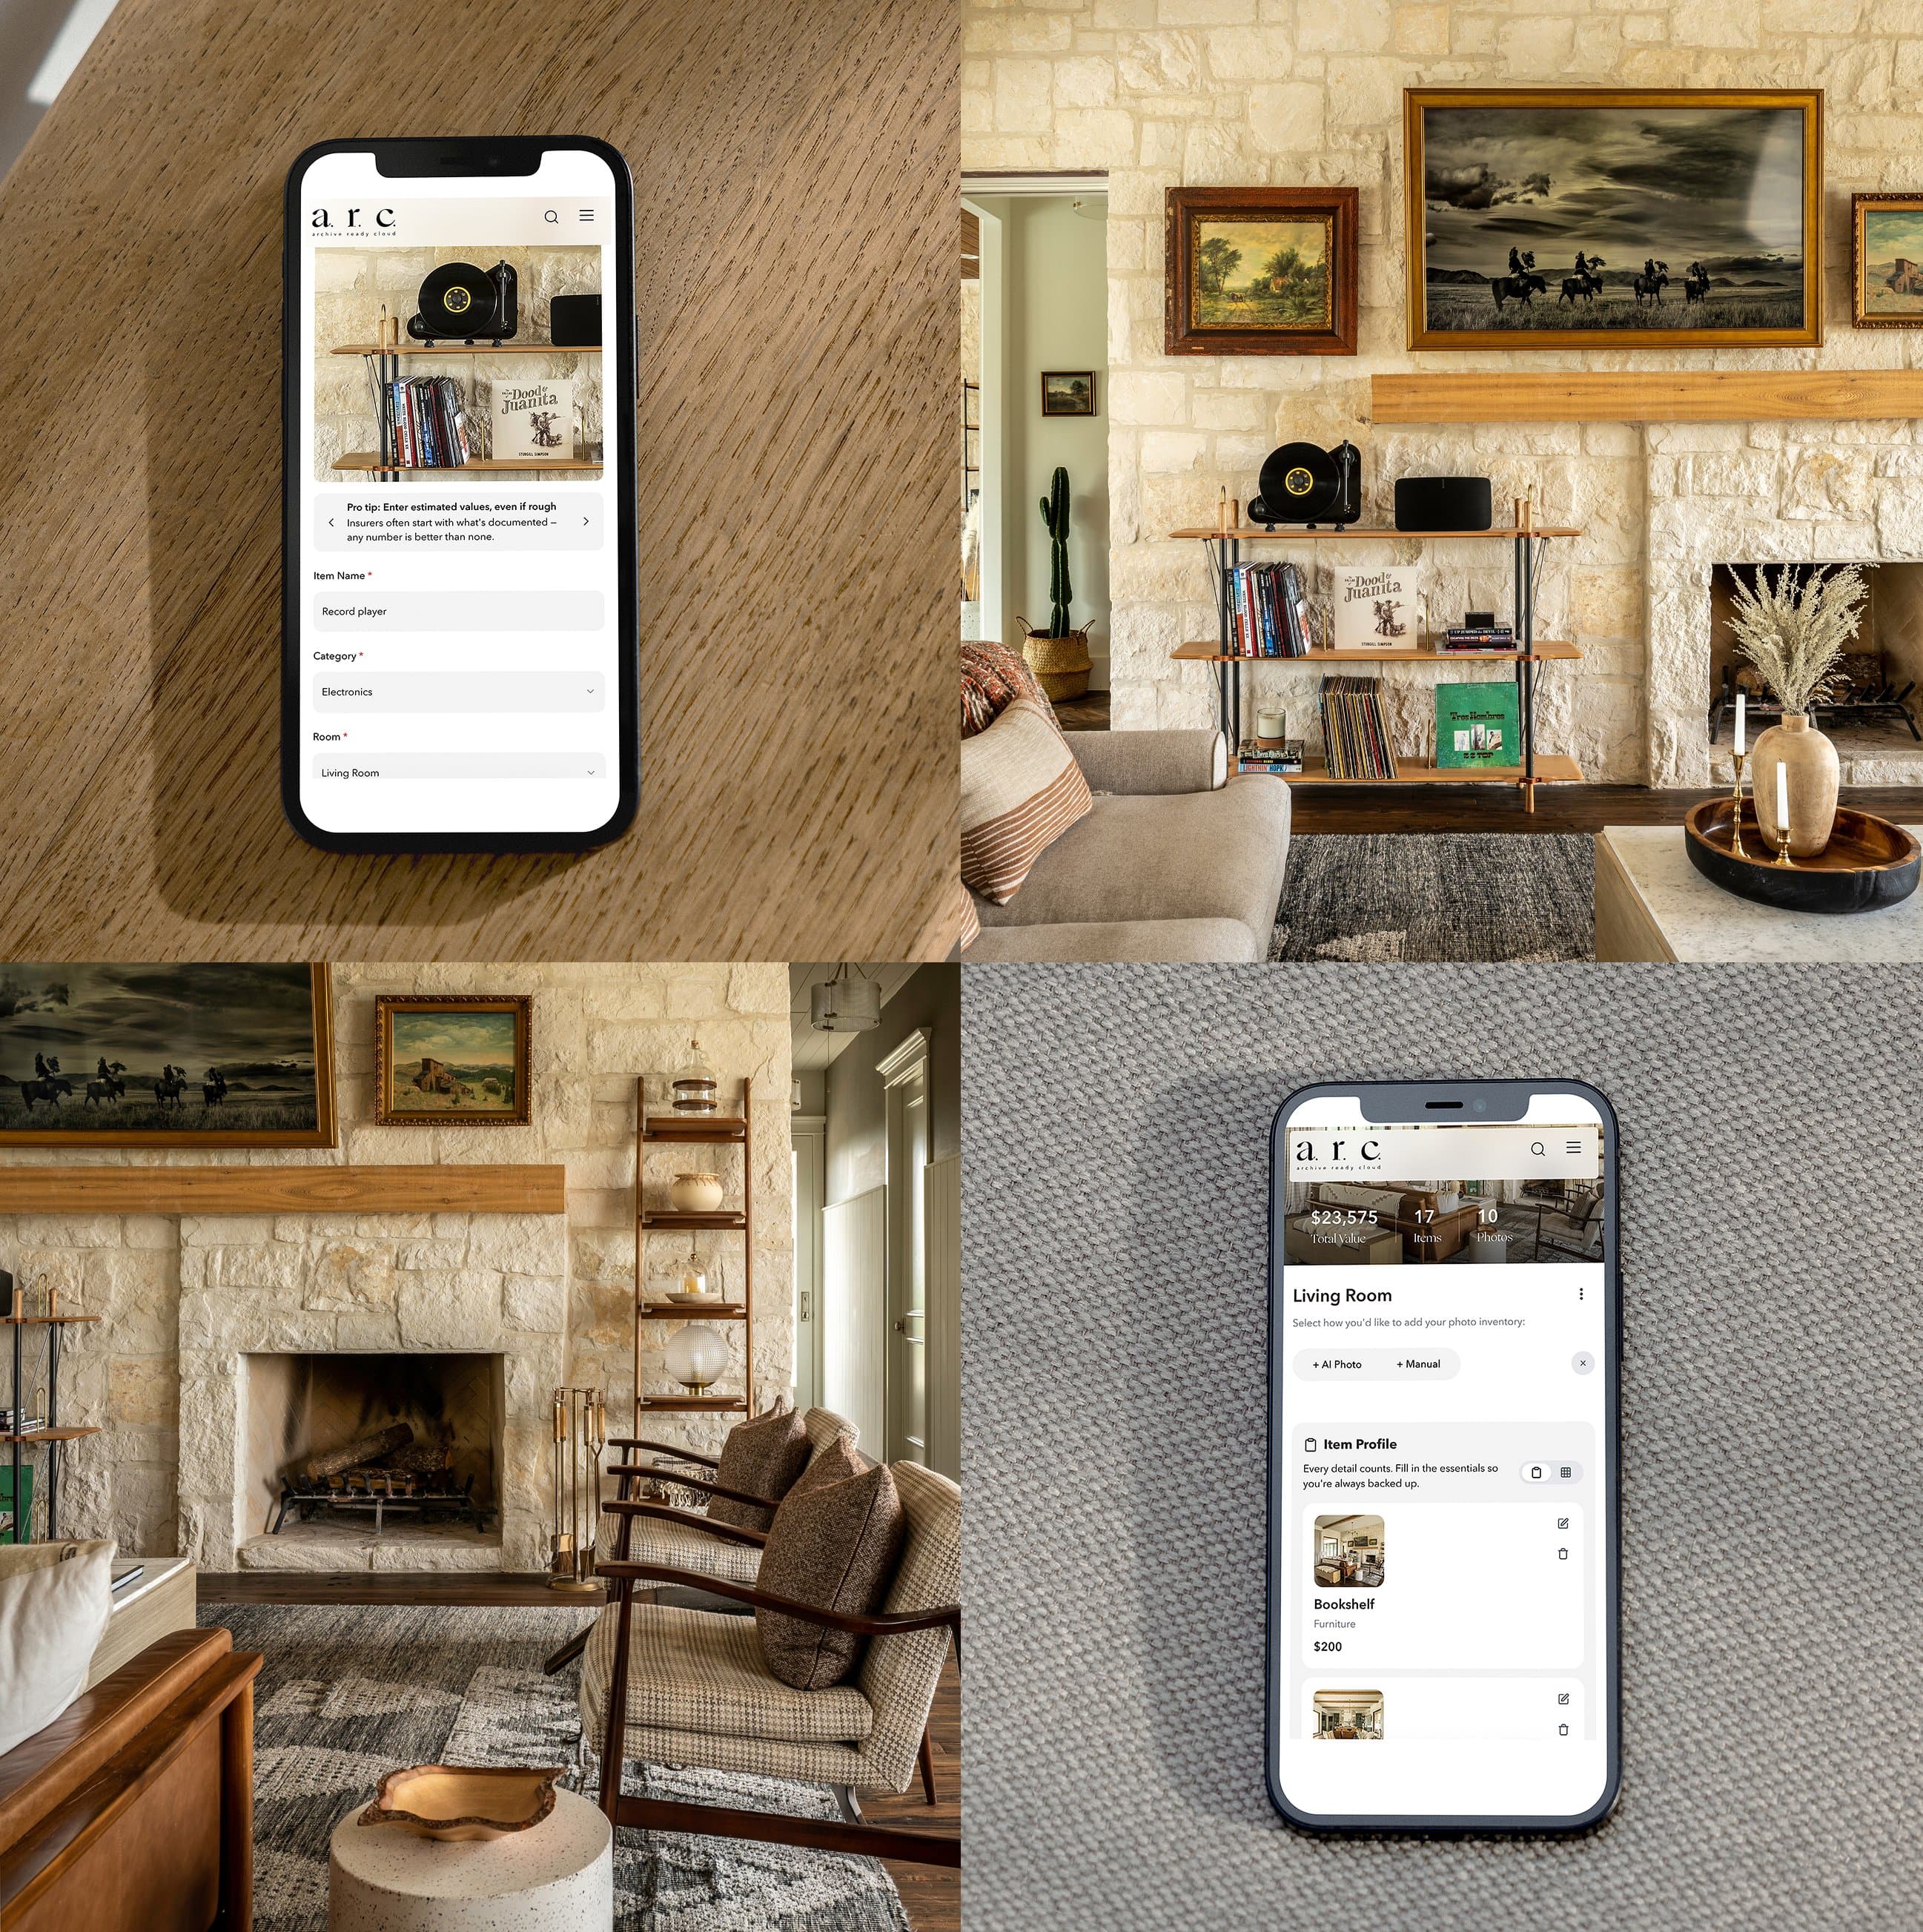
Room View
Each documented room functions as a contained archive. Items displayed as cards with thumbnail, name, category, and value. Sortable by value, category, or date added. The room becomes a gallery of your own possessions, organized for both browsing and analysis.

Document AI
Upload a receipt, appraisal, warranty, or insurance document. AI extracts relevant details: purchase date, amount, vendor, coverage terms. The extracted data associates with the corresponding item automatically when possible, or prompts the user for assignment.

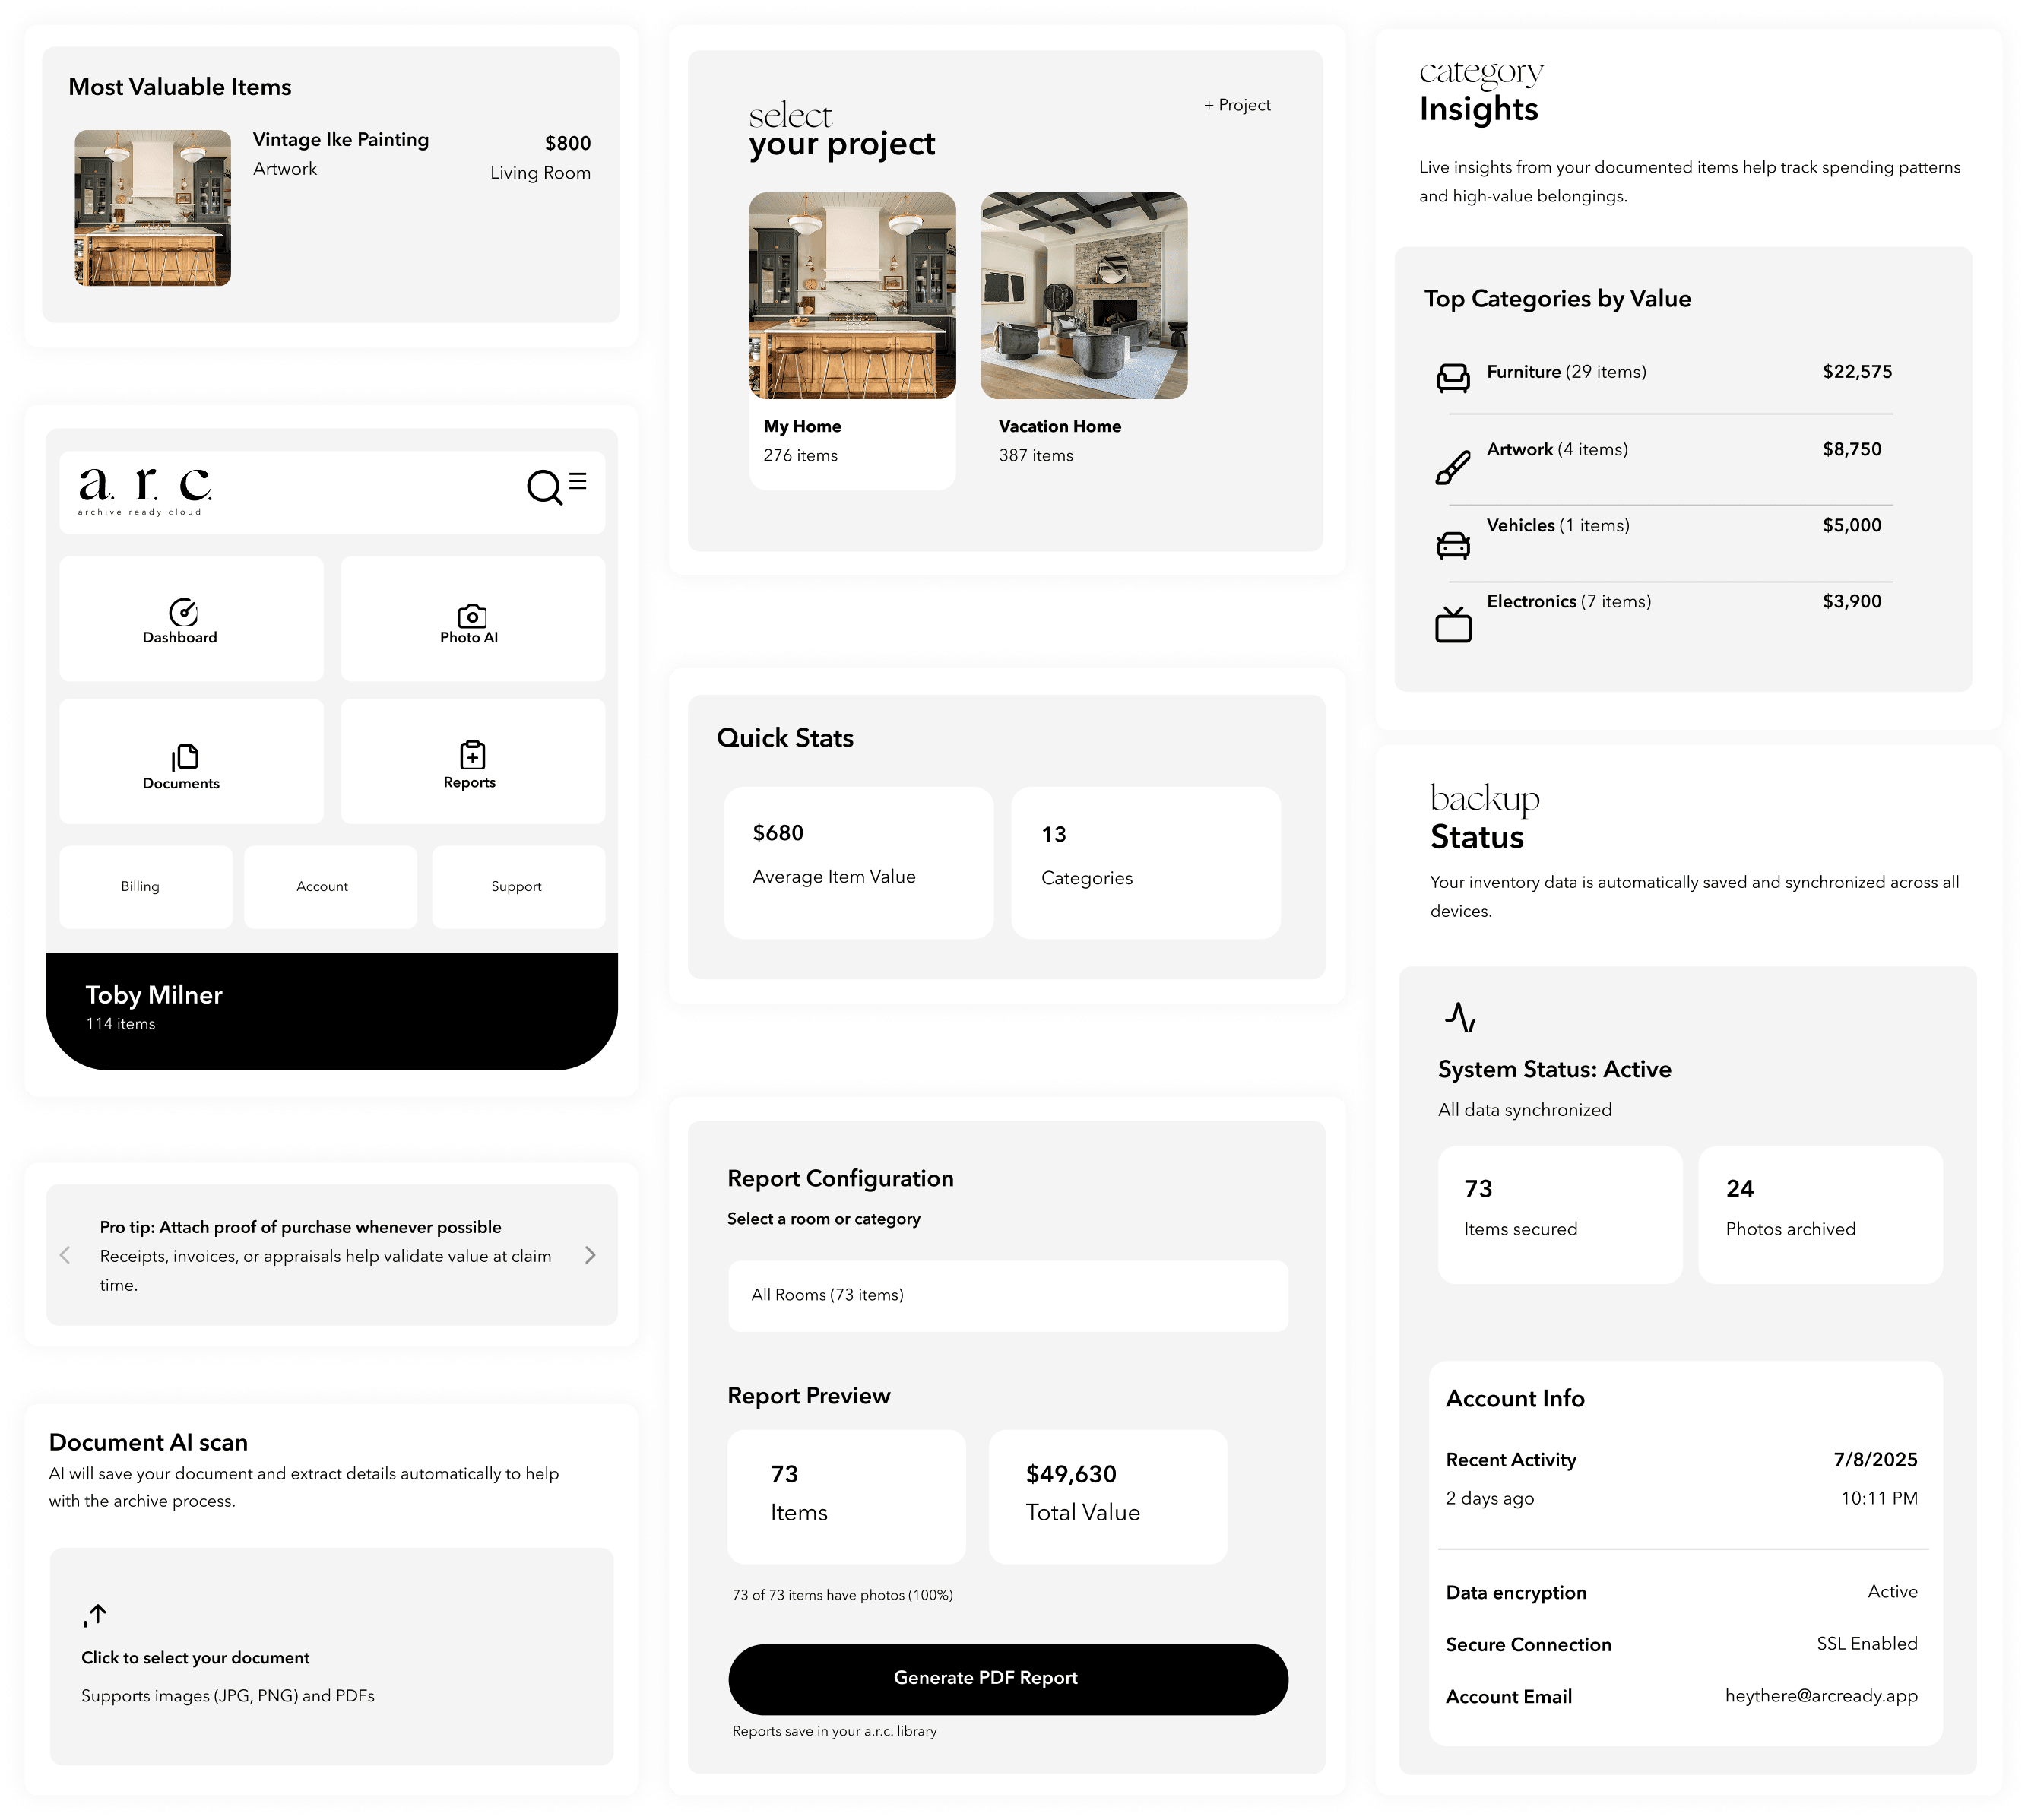
Reports
Generate PDF summaries for insurance review, estate planning, or personal reference. Configurable by room, category, or full home. Includes item photographs, descriptions, values, and aggregate statistics. Formatted for professional presentation to agents or advisors.
Dashboard View
The home screen presents aggregate intelligence. Total items documented. Total estimated value. Category breakdown. Coverage status. Recent activity. The information hierarchy prioritizes financial awareness: what you own, what it's worth, whether you're covered.
Room View
Each documented room functions as a contained archive. Items displayed as cards with thumbnail, name, category, and value. Sortable by value, category, or date added. The room becomes a gallery of your own possessions, organized for both browsing and analysis.
Document AI
Upload a receipt, appraisal, warranty, or insurance document. AI extracts relevant details: purchase date, amount, vendor, coverage terms. The extracted data associates with the corresponding item automatically when possible, or prompts the user for assignment.
Reports
Generate PDF summaries for insurance review, estate planning, or personal reference. Configurable by room, category, or full home. Includes item photographs, descriptions, values, and aggregate statistics. Formatted for professional presentation to agents or advisors.
Scroll to explore →
Field Observations
Traditional manual inventory of a 73-item home: estimated 8-12 hours. A.R.C. documentation of the same scope: under 30 minutes. Reduction factor: 16-24x.
Metrics reflect V1 usage since launch. Early-stage numbers. Presented without inflation.
DEVELOPMENT TIMELINE
10 weeks, concept to launch
Scroll to explore →
Currently in Market V1 Live
I built A.R.C. because I needed it. A renovated house, years of collected objects, nothing documented anywhere that would survive an insurance claim.
V1 is live and in market. V2 work is underway - native iOS, enhanced scanning, deeper financial analysis. The V1 foundation supports it all without a rebuild.
Services
Product Design
Brand Identity
Full-Stack Engineering
Go-to-Market Strategy
Stack
Python
Streamlit
OpenAI Vision API
Perceptron Mk1
Supabase
Vercel
Claude Code
Links
A.R.C. is live and in market - not a prototype, not a demo. Real users, a real roadmap, a product that exists because I needed it and couldn't find it.
The version out there right now does the core job. Camera identifies what's in the room, the system values it, and the financial side tells you whether your coverage is enough. It works because the hard part - the tedious item-by-item entry that stopped everyone before - is gone.
I keep thinking about the fact that this is a complete product - brand, code, financial logic, go-to-market - built in ten weeks. That wasn't possible two years ago. I don't fully know what to do with that yet. But I know it changes what's possible for the next one.